
Data Analytics at Disney Interactive
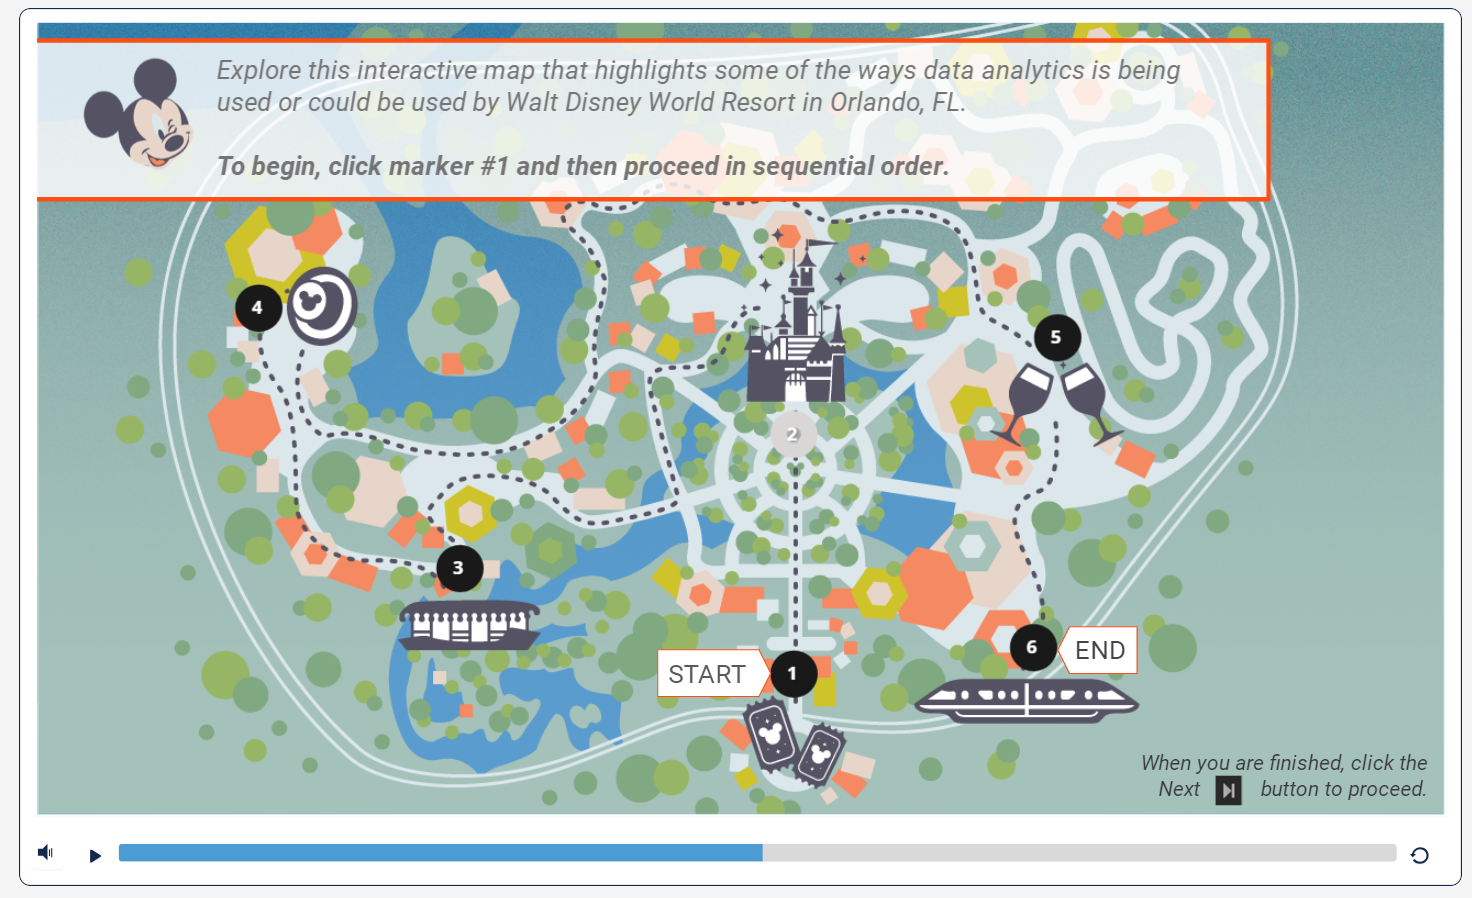
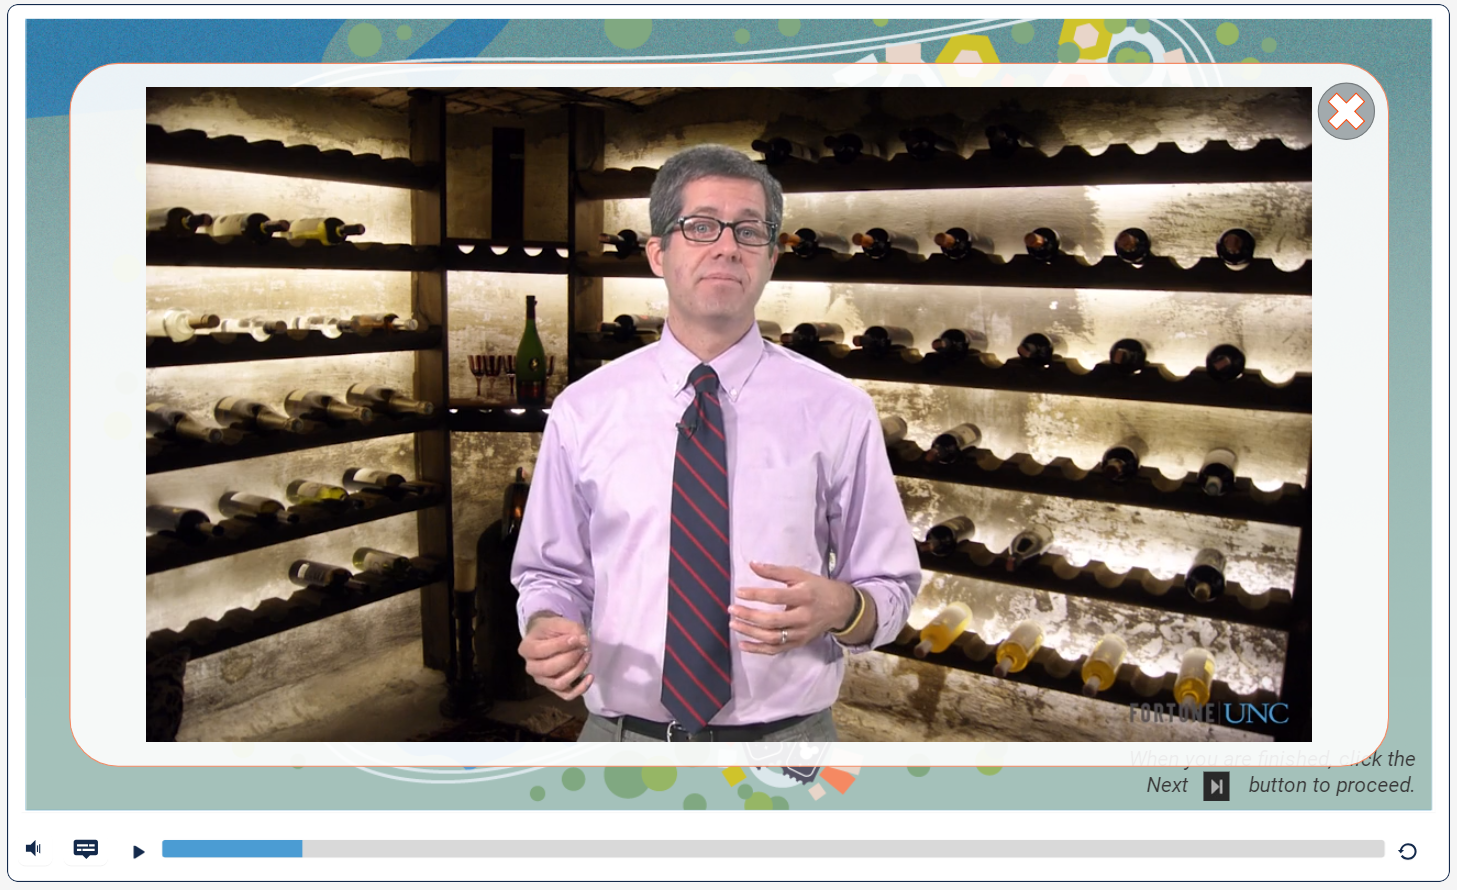
This interactive was created for a Data Analytics course. When learners click each marker on the map, they learn more about how data analytics are used by Disney in those park attractions. For example, when they click on Cinderella’s Castle, they learn about the operational command center that is reported to be below Cinderella’s Castle and serves as the “nerve center” for the park, forcasting traffic at locations all around the park. The instructor appears on green screen as if he is in the command center himself.
